“It’s 2025—can you believe the incredible potential mid-market businesses are unlocking through data analytics?” Business intelligence, machine learning, and AI integration have been employed by mid-market analytics teams to improve company performance. Of course, the reason is clear. Without the right tools, it’s easy for a business to drown instead of steering towards success.
Numbers as themselves do not narrate a story. They require context, structure, and clarity. Beyond that, there must be a way to present them. That’s where data visualization comes in. Many businesses around you are turning their messy spreadsheets into clear insights through big data analytics and smart tools, creating opportunities faster and smarter. It’s time for you to choose between steady growth and missed chances.
What is a data visualization tool?
All businesses are met with extremely large volumes of data and datasets that are generated through customer interaction, marketing efforts, financial transactions, supply chains, and more. Big data analytics helps to collect, process, clean, and analyze these large data to find trends, patterns, and correlated data that help a company to make informed decisions.
Analysis of data involves data mining, predictive analytics, and deep learning. Data visualization tools act as the expert translator, transforming raw data to real-time changes. The data visualization tools let you turn flat spreadsheets, shuffled dashboards, or disconnected systems into visual stories, paving the way for fresh updates, interactive visuals, and collaborative features that transform data from static records into powerful fuel for decision-making.
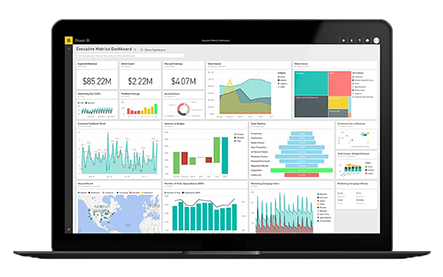
Power BI: Microsoft’s Data Powerhouse
As Microsoft’s leading business intelligence platform designed to turn raw numbers into actionable insights, Power BI is meticulously crafted and presents seamless integration with Excel, Azure, Teams, and SharePoint, providing a familiar interface for companies already in the Microsoft ecosystem. For mid-market teams, Power BI is a cost-effective option that scales easily and stands out with user-friendly dashboards, smooth data flow across Microsoft apps, and Copilot AI. Power BI is flexible with options of cloud, on-premises, or hybrid—making it a practical choice for companies balancing affordability and operational agility.
Tableau: Salesforce’s Visualization Storyteller
For businesses ready to elevate their analytics with impactful visuals, executive-ready dashboards, and seamless cross-platform integrations, Tableau delivers exceptional value. As part of Salesforce, Tableau is crafted with sophisticated, interactive dashboards and unparalleled data storytelling capabilities. Tableau is packed with analytics, cloud and big-data source connectivity, and seamless integration of dashboards to apps and customer platforms. Tableau in 2025 is as impactful as Power BI, packed with refined design versatility, extensive connectivity, and collaborative tools such as Tableau Pulse. Though placed at a higher price point, Tableau remains the preferred option for quality of presentation and effective storytelling.
Power BI vs Tableau: Key Differences That Mid-Market Teams Should Consider in 2025
While Power BI and Tableau are best at delivering connectivity to a wide range of data sources, interactive dashboards & dashboard sharing, collaborative platforms, and AI features, they do have capabilities and differences.
User-friendly interface
Which Business Intelligence Tool to Choose in 2025?
Now it’s time to make a good choice. If your company is already using the Microsoft ecosystem and wants to prioritize the budget, speed, and ease of integration, clearly Power BI is the best option. If your mid-market experts require more impactful visuals and comprehensive data analysis and are previously experienced with Salesforce, Tableau is a wise choice. Moreover, certain businesses may choose a hybrid system, getting better results by employing Power BI for routine operational activities and Tableau for sophisticated analytics and storytelling.
If you still need good guidance in choosing the right tool for your business, consult Techphronesis LLC today. Our seasoned experts will help you select the best visualization tool apt for your business and guide your growth with data visualization solutions.
We’re here to assist with all your technology needs. Whether you have a specific project in mind or need guidance on the best solutions for your business, we’re ready to help. Please fill out the form below with your details and requirements, or feel free to reach out via email for more specific inquiries.
Our team will promptly get in touch to discuss how we can support your technology goals and deliver the best solutions tailored to your needs.